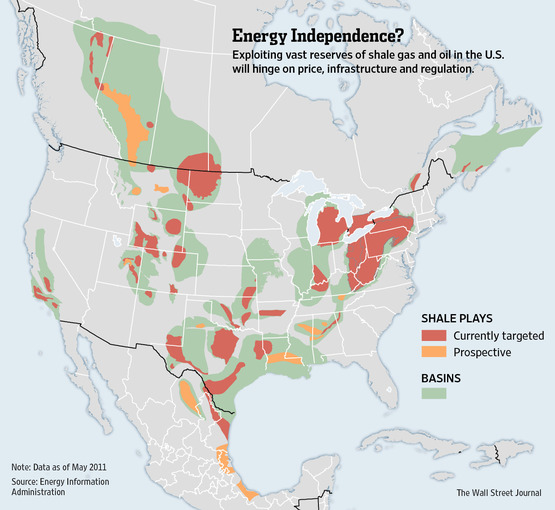
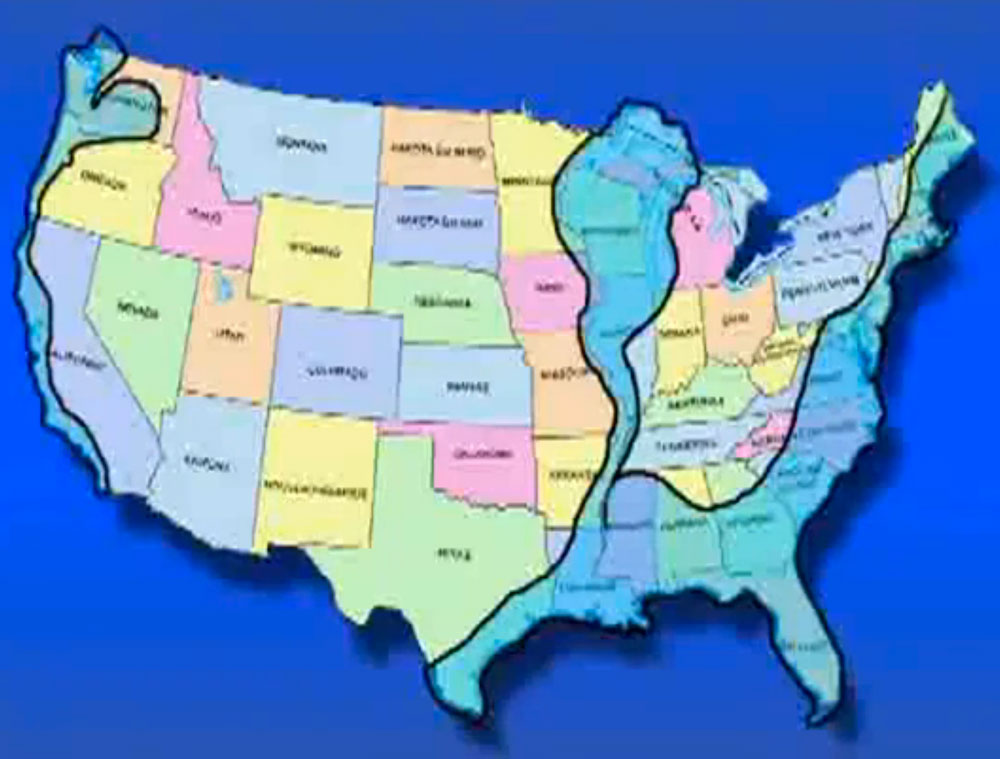
While doing research for a project recently, I came across these three different graphics. The first graphic is a snapshot of the recent (last six months) earthquakes in the Midwest, especially around the New Madrid Seismic Zone. The second graphic appeared in the Wall Street Journal two days ago, and illustrates the various basins that are being tapped for shale oil via fracking. The third graphic is a map that was produced by military remote viewers (psychic spies) to show how the geography of the North American continent will change after a major seismic event centered in the Midwest (like the New Madrid cutting loose).
Interesting, yes? I found it so.